Plot a before-after plot with lines joining shape-matched symbols.
Source:R/plot_befafter_shapes.R
plot_befafter_shapes.RdOne of 3 related functions to plot matching data joined by lines. The variable containing information for matching (e.g. matched subjects or experiments etc.) is passed to the match argument.
plot_befafter_shapes
plot_befafter_shapes(
  data,
  xcol,
  ycol,
  match,
  facet,
  Boxplot = FALSE,
  symsize = 3,
  s_alpha = 1,
  bwid = 0.4,
  jitter = 0.1,
  TextXAngle = 0,
  LogYTrans,
  LogYBreaks = waiver(),
  LogYLabels = waiver(),
  LogYLimits = NULL,
  facet_scales = "fixed",
  fontsize = 20,
  symthick,
  bthick,
  lthick,
  ColPal = c("okabe_ito", "all_grafify", "bright", "contrast", "dark", "fishy", "kelly",
    "light", "muted", "pale", "r4", "safe", "vibrant"),
  ColSeq = TRUE,
  ColRev = FALSE,
  SingleColour = "NULL",
  ...
)
Arguments
- data
a data table object, e.g. data.frame or tibble.
- xcol
name of the column (without quotes) containing the categorical variable to be plotted on the X axis.
- ycol
name of the column (without quotes) with the quantitative variable to plot on the Y axis.
- match
name of the column (without quotes) with the matching variable to pass on to
geom_line.- facet
add another variable (without quotes) from the data table to create faceted graphs using
facet_wrap.- Boxplot
logical TRUE/FALSE, whether to show box and whisker plot or not (default is FALSE)
- symsize
size of symbols, default set to 3.
- s_alpha
fractional opacity of symbols, default set to 1.
- bwid
width of boxplots; default 0.4.
- jitter
extent of jitter (scatter) of symbols, default is 0.1. Increase to reduce symbol overlap, set to 0 for aligned symbols.
- TextXAngle
orientation of text on X-axis; default 0 degrees. Change to 45 or 90 to remove overlapping text.
- LogYTrans
transform Y axis into "log10" or "log2" (in quotes).
- LogYBreaks
argument for
scale_y_continuousfor Y axis breaks on log scales, default iswaiver(), or provide a vector of desired breaks.- LogYLabels
argument for
scale_y_continuousfor Y axis labels on log scales, default iswaiver(), or provide a vector of desired labels.- LogYLimits
a vector of length two specifying the range (minimum and maximum) of the Y axis.
- facet_scales
whether or not to fix scales on X & Y axes for all facet facet graphs. Can be
fixed(default),free,free_yorfree_x(for Y and X axis one at a time, respectively).- fontsize
parameter of
base_sizeof fonts intheme_classic, default set to size 20.- symthick
size (in 'pt' units) of outline of symbol lines (
stroke), default =fontsize/22.- bthick
thickness (in 'pt' units) of boxes; default =
(fontsize)/22.- lthick
thickness (in 'pt' units) of lines; default =
(fontsize/1.2)/22.- ColPal
grafify colour palette to apply (in quotes), default "okabe_ito"; see
graf_palettesfor available palettes.- ColSeq
logical TRUE or FALSE. Default TRUE for sequential colours from chosen palette. Set to FALSE for distant colours, which will be applied using
scale_fill_grafify2.- ColRev
whether to reverse order of colour within the selected palette, default F (FALSE); can be set to T (TRUE).
- SingleColour
a colour hexcode (starting with #, e.g., "#E69F00"), a number between 1-154, or names of colours from
grafifyor base R palettes to fill along X-axis aesthetic. Accepts any colour other than "black"; usegrey_lin11, which is almost black.- ...
any additional arguments to pass to
geom_lineorgeom_point.
Value
This function returns a ggplot2 object of class "gg" and "ggplot".
Details
In plot_befafter_colours/plot_befafter_colors and plot_befafter_shapes setting Boxplot = TRUE will also plot a box and whiskers plot.
Note that only 25 shapes are available, and there will be errors with plot_befafter_shapes when there are fewer than 25 matched observations; instead use plot_befafter_colours instead.
Colours can be changed using ColPal, ColRev or ColSeq arguments.
ColPal can be one of the following: "okabe_ito", "dark", "light", "bright", "pale", "vibrant, "muted" or "contrast".
ColRev (logical TRUE/FALSE) decides whether colours are chosen from first-to-last or last-to-first from within the chosen palette.
ColSeq decides whether colours are picked by respecting the order in the palette or the most distant ones using colorRampPalette.
To plot a graph with a single colour along the X axis variable, use the SingleColour argument.
The resulting ggplot2 graph can take additional geometries or other layers.
Examples
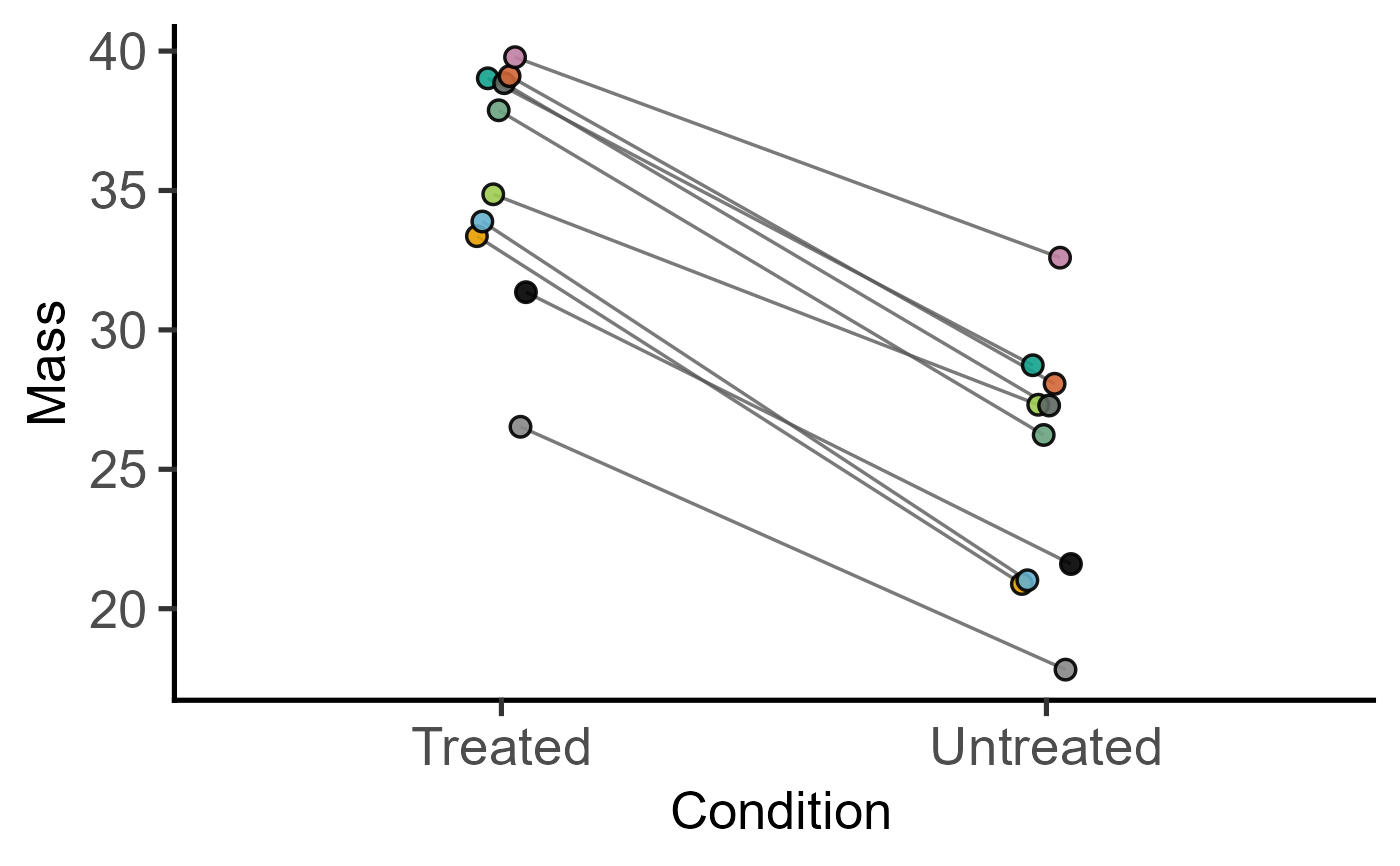
#plot without legends if necessary
plot_befafter_colors(data = data_t_pdiff,
xcol = Condition, ycol = Mass,
match = Subject, s_alpha = .9, ColSeq = FALSE)+
guides(fill = "none",
colour = "none") #remove guides
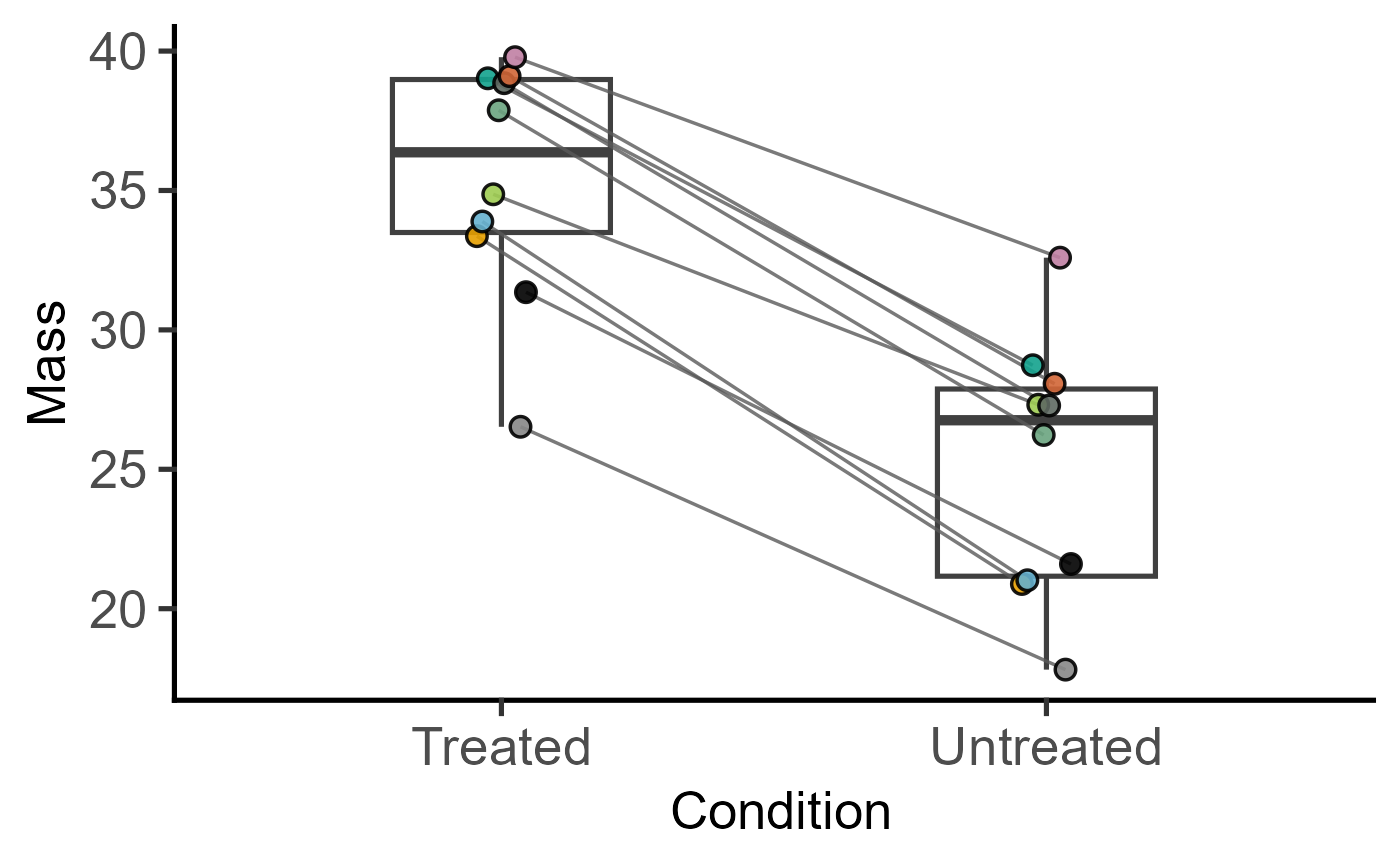
 #plot with boxplot
plot_befafter_colors(data = data_t_pdiff,
xcol = Condition, ycol = Mass,
match = Subject, s_alpha = .9, ColSeq = FALSE,
Boxplot = TRUE)+
guides(fill = "none",
colour = "none") #remove guides
#plot with boxplot
plot_befafter_colors(data = data_t_pdiff,
xcol = Condition, ycol = Mass,
match = Subject, s_alpha = .9, ColSeq = FALSE,
Boxplot = TRUE)+
guides(fill = "none",
colour = "none") #remove guides