This simple function allows quick visualisation of colours in grafify palettes and their hex codes. It uses plot_scatterbar_sd and some arguments are similar and can be adjusted.
plot_grafify_palette(
  palette = c("okabe_ito", "all_grafify", "bright", "contrast", "dark", "fishy", "kelly",
    "light", "muted", "pale", "r4", "safe", "vibrant", "OrBl_div", "PrGn_div",
    "blue_conti", "grey_conti", "yellow_conti"),
  fontsize = 14,
  ...
)
Arguments
- palette
name of grafify palettes: "okabe_ito", "vibrant, "bright", "pale", "muted", "dark", "light", "contrast" or "all_grafify".
- fontsize
font size.
- ...
any additional parameters to pass to
plot_scatterbar_sd
Value
This function returns a ggplot2 object of class "gg" and "ggplot".
Examples
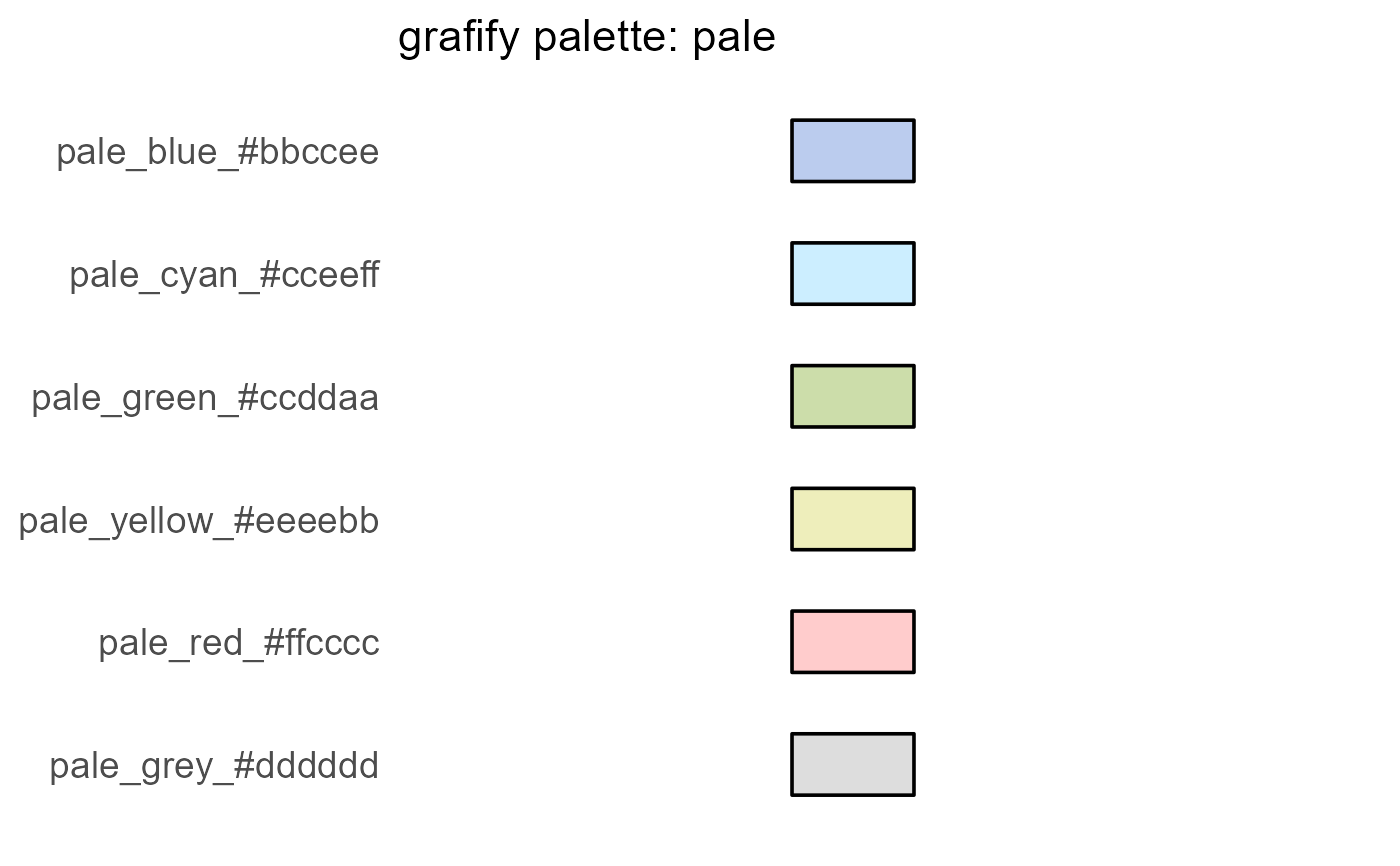
plot_grafify_palette("pale")
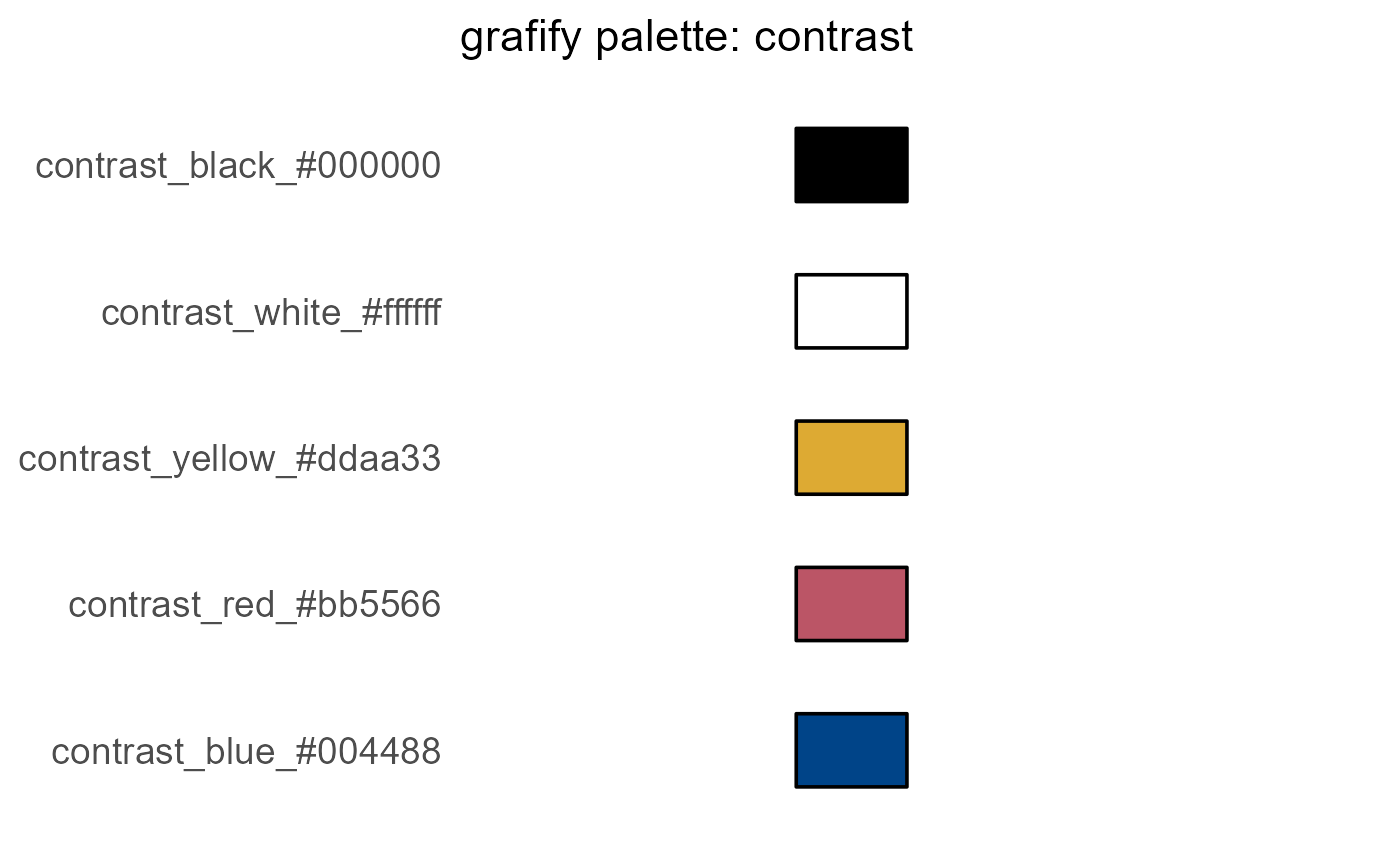
 plot_grafify_palette("contrast")