This function allows "log10" or "log2" transformation of X or Y axes. With "log10" transformation, log10 ticks are also added on the outside.
plot_logscale(
  Plot,
  LogYTrans = "log10",
  LogXTrans,
  LogYBreaks = waiver(),
  LogXBreaks = waiver(),
  LogYLimits = NULL,
  LogXLimits = NULL,
  LogYLabels = waiver(),
  LogXLabels = waiver(),
  fontsize = 22,
  ...
)
Arguments
- Plot
a ggplot2 object.
- LogYTrans
transform Y axis into "log10" (default) or "log2"
- LogXTrans
transform X axis into "log10" or "log2"
- LogYBreaks
argument for
scale_y_continuousfor Y axis breaks on log scales, default iswaiver(), or provide a vector of desired breaks.- LogXBreaks
argument for
scale_x_continuousfor Y axis breaks on log scales, default iswaiver(), or provide a vector of desired breaks.- LogYLimits
a vector of length two specifying the range (minimum and maximum) of the Y axis.
- LogXLimits
a vector of length two specifying the range (minimum and maximum) of the X axis.
- LogYLabels
argument for
scale_y_continuousfor Y axis labels on log scales, default iswaiver(), or provide a vector of desired labels.- LogXLabels
argument for
scale_x_continuousfor Y axis labels on log scales, default iswaiver(), or provide a vector of desired labels.- fontsize
this parameter sets the linewidth of the
log10tickmarks (8*fontsize/22for long ticks and4*fontsize/22for middle ticks). It is set to 20 as default to be consistent with rest ofgrafify. It will need to be changed to 12, which is the default fontsize for graphs produced natively withggplot2.- ...
any other arguments to pass to
scale_y_continuousorscale_x_continuous
Value
This function returns a ggplot2 object of class "gg" and "ggplot".
Details
Arguments allow for axes limits, breaks and labels to passed on.
Examples
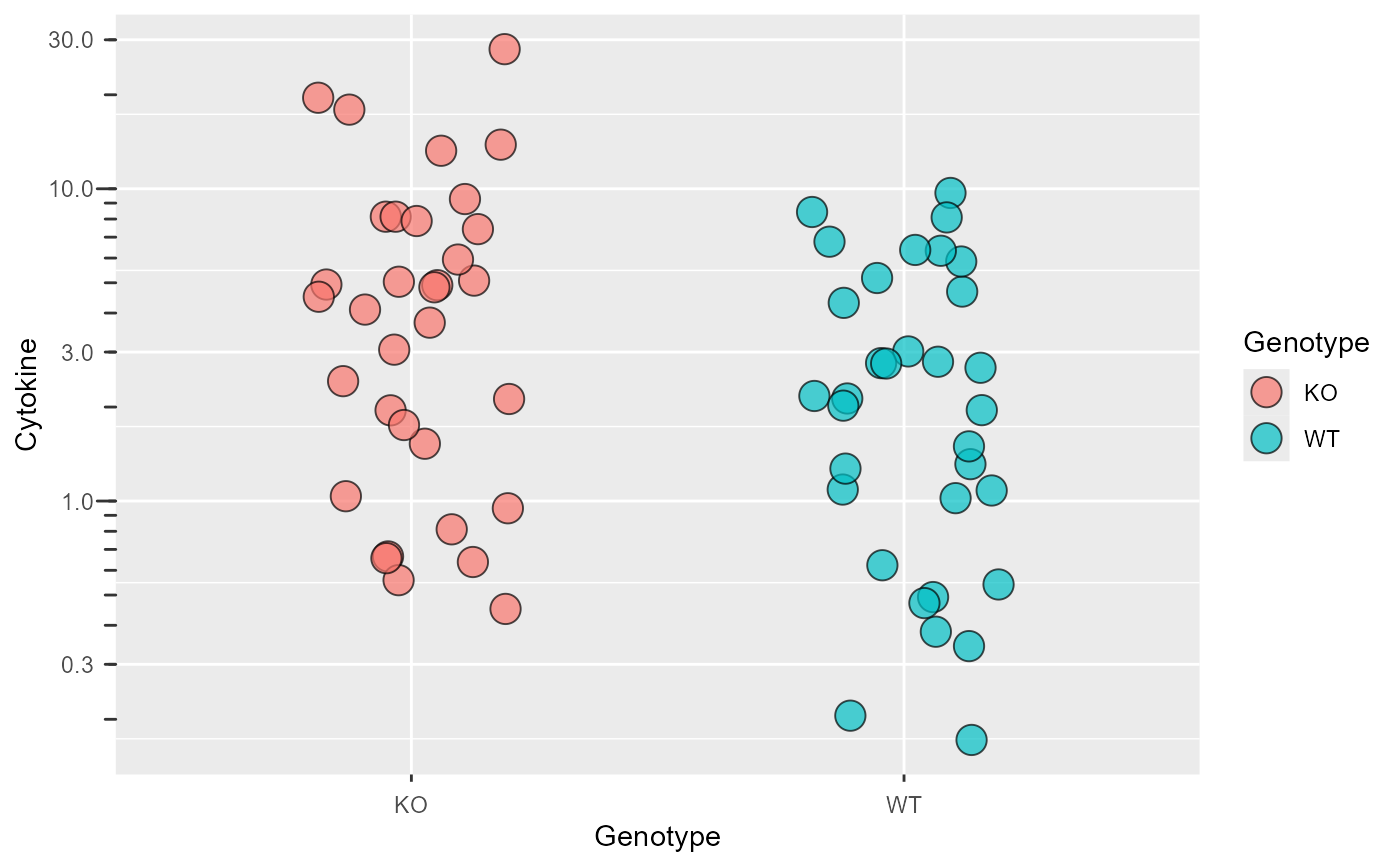
#save a ggplot object
P <- ggplot(data_t_pratio,
aes(Genotype,Cytokine))+
geom_jitter(shape = 21,
size = 5, width = .2,
aes(fill = Genotype),
alpha = .7)
#transform Y axis
plot_logscale(Plot = P)
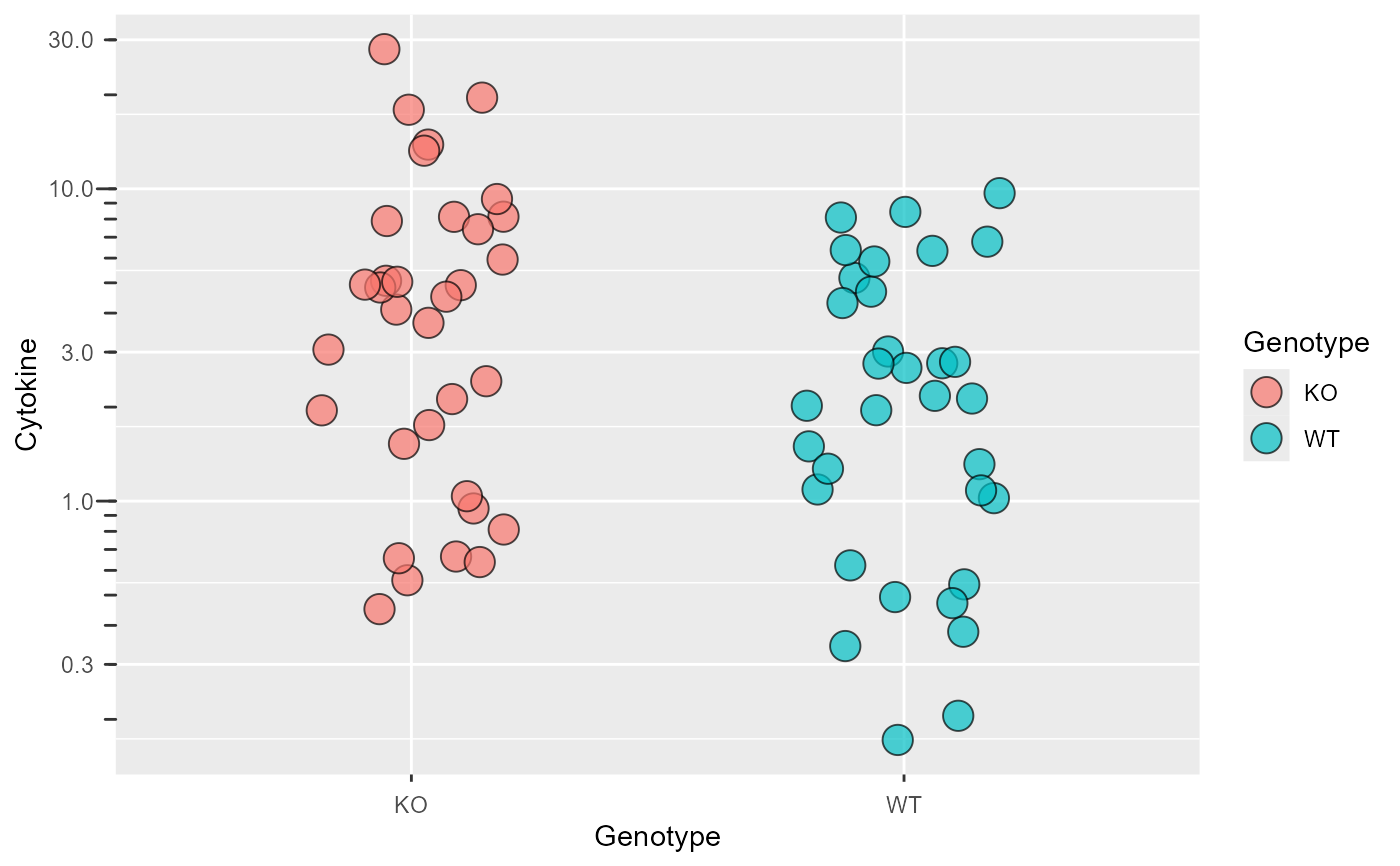 #or in one go
plot_logscale(ggplot(data_t_pratio,
aes(Genotype,Cytokine))+
geom_jitter(shape = 21,
size = 5, width = .2,
aes(fill = Genotype),
alpha = .7))
#or in one go
plot_logscale(ggplot(data_t_pratio,
aes(Genotype,Cytokine))+
geom_jitter(shape = 21,
size = 5, width = .2,
aes(fill = Genotype),
alpha = .7))