This simple function takes in a data table and reorders groups (categorical variables or factors) to be plotted along the X-axis in a user-defined order.
table_x_reorder(data, xcol, OrderX, ...)Arguments
Value
This function returns a data frame with a selected column converted into factor with reordered levels.
Details
It uses two base R functions: as.factor to first force the user-selected column into a factor, and factor that reorders levels based on a user-provided vector.
Examples
#reorder levels within Genotype
new_data <- table_x_reorder(data_t_pratio,
xcol = "Genotype",
OrderX = c("KO", "WT"))
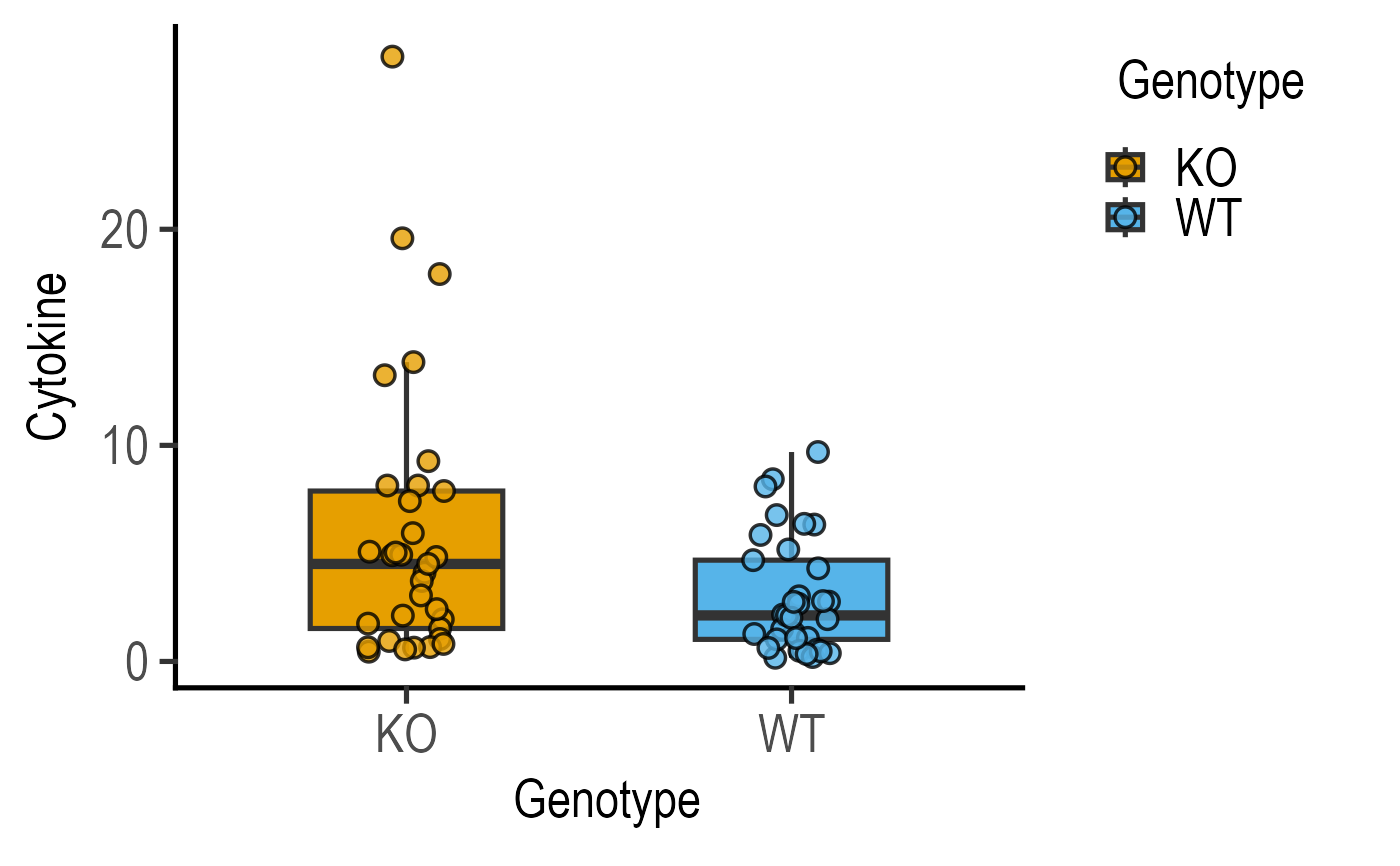
#compare
plot_scatterbox(data_t_pratio,
Genotype,
Cytokine)
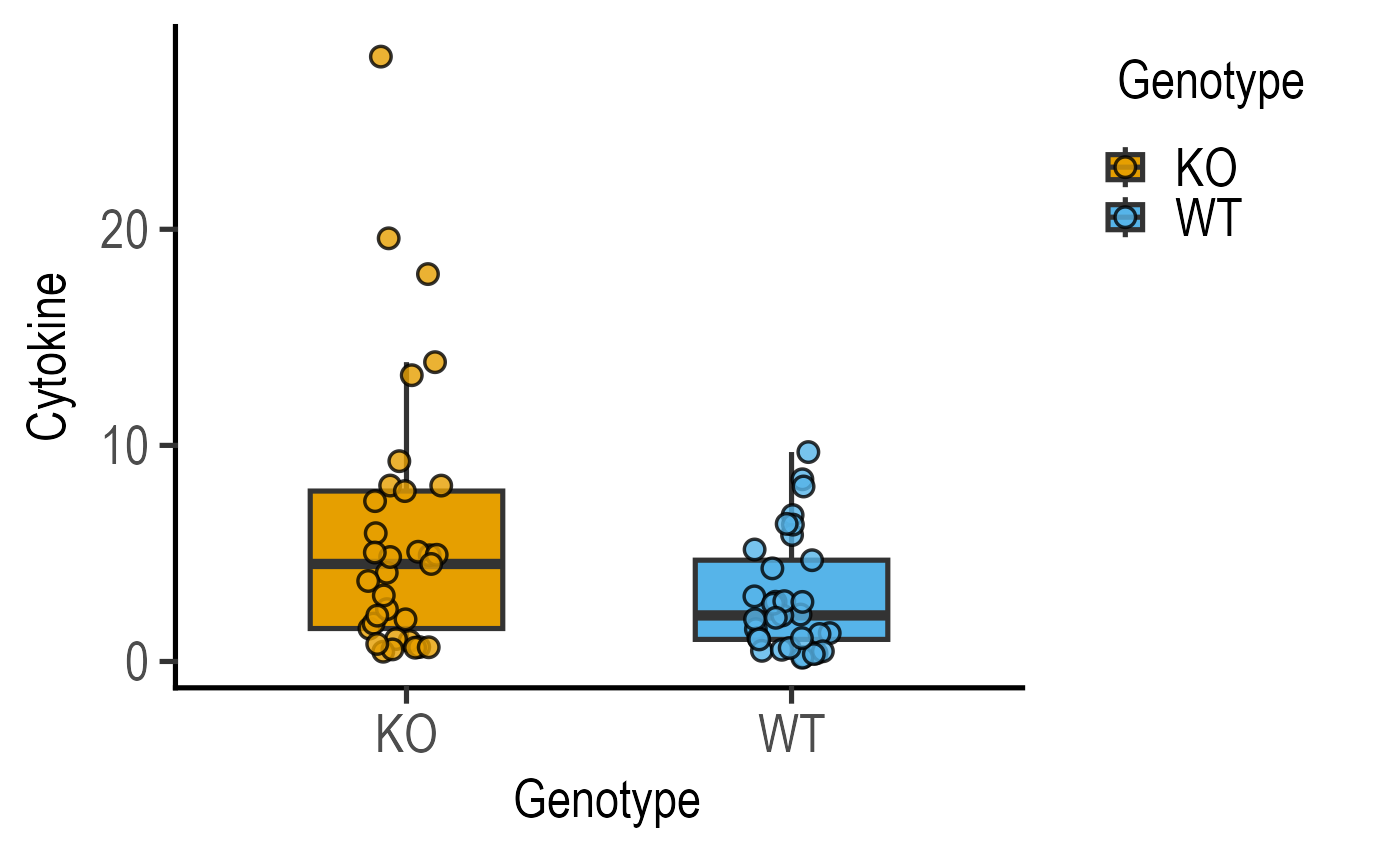
 #with
plot_scatterbox(new_data,
Genotype,
Cytokine)
#with
plot_scatterbox(new_data,
Genotype,
Cytokine)
 #also works within the plot call
plot_scatterbox(data = table_x_reorder(data_t_pratio,
xcol = "Genotype",
OrderX = c("KO", "WT")),
xcol = Genotype,
ycol = Cytokine)
#also works within the plot call
plot_scatterbox(data = table_x_reorder(data_t_pratio,
xcol = "Genotype",
OrderX = c("KO", "WT")),
xcol = Genotype,
ycol = Cytokine)
