Plot prediction of gam model
plot_gam_predict(
  Model,
  xcol,
  ycol,
  ByFactor,
  symsize = 1,
  s_alpha = 0.1,
  smooth_alpha = 0.7,
  linethick,
  fontsize = 20,
  ...
)
Arguments
- Model
a generalised additive model (
gam) fitted withga_modelormgcv- xcol
the smooth in the
gam(should match variable in the model exactly)- ycol
the dependent variable in
gam(should match variable in the model exactly)- ByFactor
the
byfactor used ingam(should match variable in the model exactly)- symsize
size of symbols (default = 1)
- s_alpha
opacity of symbols (default = 0.1)
- smooth_alpha
opacity of the predicted CI interval (default = 0.7)
- linethick
thickness of symbol lines (default = fontsize/22)
- fontsize
base font size for graph
- ...
additional arguments to pass to
plot_xy_CatGroup.
Value
This function returns a ggplot2 object of class "gg" and "ggplot".
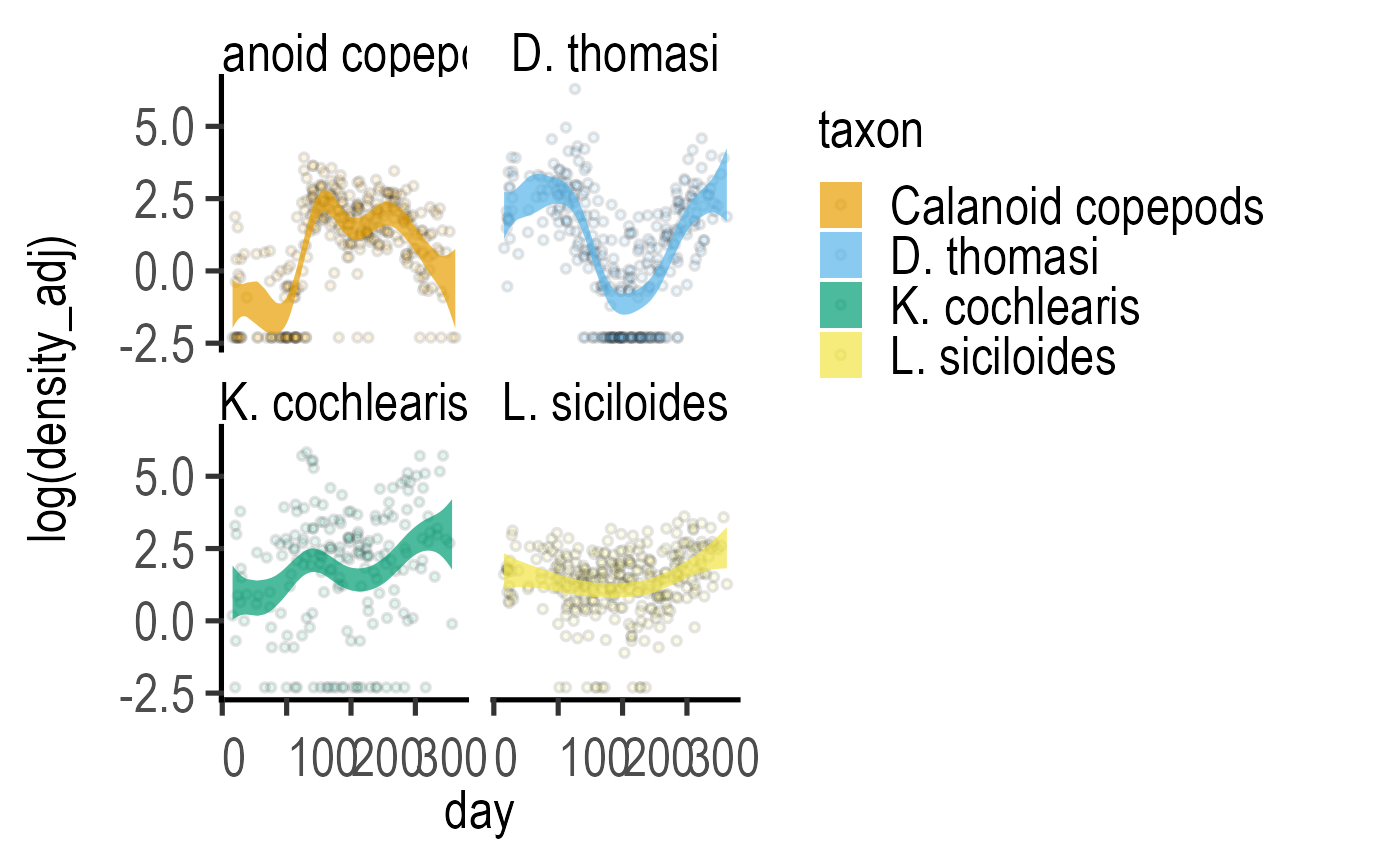
Examples
#fit zooplankton data
z1 <- ga_model(data = data_zooplankton,
Y_value = "log(density_adj)",
Fixed_Factor = "taxon",
Smooth_Factor = "day")

#plot fitted data
plot_gam_predict(Model = z1,
xcol = day,
ycol = `log(density_adj)`,
ByFactor = taxon)