Plot points on a quantitative X - Y plot & a categorical grouping variable.
Source:R/plot_xy_CatGroup.R
plot_xy_CatGroup.RdThis function takes a data table, quantitative X and Y variables along with a categorical grouping variable, and a and plots a graph with using geom_point. The categorical CatGroup variable is mapped to the fill aesthetic of symbols.
plot_xy_CatGroup(
  data,
  xcol,
  ycol,
  CatGroup,
  facet,
  Boxplot = FALSE,
  Mean = FALSE,
  ErrorType = "SD",
  symsize = 3,
  s_alpha = 0.8,
  TextXAngle = 0,
  LogYTrans,
  LogXTrans,
  LogYBreaks = waiver(),
  LogXBreaks = waiver(),
  LogYLabels = waiver(),
  LogXLabels = waiver(),
  LogYLimits = NULL,
  LogXLimits = NULL,
  facet_scales = "fixed",
  fontsize = 20,
  bwid = 0.3,
  b_alpha = 0.3,
  l_alpha = 0.8,
  e_alpha = 0.8,
  all_size = 2,
  all_alpha = 0.5,
  symthick,
  bthick,
  ethick,
  ewid = 0.2,
  ColPal = c("okabe_ito", "all_grafify", "bright", "contrast", "dark", "fishy", "kelly",
    "light", "muted", "pale", "r4", "safe", "vibrant"),
  ColSeq = TRUE,
  ColRev = FALSE,
  ...
)
Arguments
- data
a data table object, e.g. data.frame or tibble.
- xcol
name of the column (without quotes) with quantitative X variable.
- ycol
name of the column (without quotes) with quantitative Y variable.
- CatGroup
a categorical variable as grouping factor for colour of data points, should be a categorical variable for default colours to work. Will be converted to
factorif your column is numeric- facet
add another variable (without quotes) from the data table to create faceted graphs using
facet_wrap.- Boxplot
logical TRUE/FALSE to plot box and whiskers plot (default = FALSE).
- Mean
logical TRUE/FALSE to plot mean and SD/SEM/CI95 error bars (default = FALSE).
- ErrorType
select the type of error bars to display. Default is "SD" (standard deviation). Other options are "SEM" (standard error of the mean) and "CI95" (95% confidence interval based on t distributions).
- symsize
size of symbols used by
geom_point. Default set to 3.- s_alpha
fractional opacity of symbols, default set to to 0.8 (i.e, 80% opacity).
- TextXAngle
orientation of text on X-axis; default 0 degrees. Change to 45 or 90 to remove overlapping text.
- LogYTrans
transform Y axis into "log10" or "log2" (in quotes).
- LogXTrans
transform X axis into "log10" or "log2"
- LogYBreaks
argument for
ggplot2[scale_y_continuous]for Y axis breaks on log scales, default iswaiver(), or provide a vector of desired breaks.- LogXBreaks
argument for
ggplot2[scale_x_continuous]for Y axis breaks on log scales, default iswaiver(), or provide a vector of desired breaks.- LogYLabels
argument for
ggplot2[scale_y_continuous]for Y axis labels on log scales, default iswaiver(), or provide a vector of desired labels.- LogXLabels
argument for
ggplot2[scale_x_continuous]for Y axis labels on log scales, default iswaiver(), or provide a vector of desired labels.- LogYLimits
a vector of length two specifying the range (minimum and maximum) of the Y axis.
- LogXLimits
a vector of length two specifying the range (minimum and maximum) of the X axis.
- facet_scales
whether or not to fix scales on X & Y axes for all graphs. Can be
fixed(default),free,free_yorfree_x(for Y and X axis one at a time, respectively).- fontsize
parameter of
base_sizeof fonts intheme_classic, default set to size 20.- bwid
width of boxplot (default = 0.3).
- b_alpha
fractional opacity of boxes, (default = 0.3).
- l_alpha
fractional opacity of lines joining boxes, (default = 0.8).
- e_alpha
fractional opacity of error bars, (default = 0.8).
- all_size
size of symbols of all data points, if shown (default = 2.5).
- all_alpha
fractional opacity of all data points (default = 0.3). Set to non-zero value if you would like all data points plotted in addition to the mean.
- symthick
size (in 'pt' units) of outline of symbol lines (
stroke), default =fontsize/22.- bthick
size (in 'pt' units) of outline of boxes, whisker and joining lines (
stroke), default =fontsize/22.- ethick
thickness of error bar lines; default
fontsize/22.- ewid
width of error bars, default set to 0.2.
- ColPal
grafify colour palette to apply (in quotes), default "okabe_ito"; see
graf_palettesfor available palettes.- ColSeq
logical TRUE or FALSE. Default TRUE for sequential colours from chosen palette. Set to FALSE for distant colours, which will be applied using
scale_fill_grafify2.- ColRev
whether to reverse order of colour within the selected palette, default F (FALSE); can be set to T (TRUE).
- ...
any additional arguments to pass on.
Value
This function returns a ggplot2 object of class "gg" and "ggplot".
Details
A box and whisker plot with lines joining the medians can be plotted with Boxplot = TRUE. If only box plot is needed without the line, set the opacity of the line to 0 (i.e., l_alpha = 0).
Colours can be changed using ColPal, ColRev or ColSeq arguments. Colours available can be seen quickly with plot_grafify_palette.
ColPal can be one of the following: "okabe_ito", "dark", "light", "bright", "pale", "vibrant, "muted" or "contrast".
ColRev (logical TRUE/FALSE) decides whether colours are chosen from first-to-last or last-to-first from within the chosen palette.
ColSeq (logical TRUE/FALSE) decides whether colours are picked by respecting the order in the palette or the most distant ones using colorRampPalette.
This plot is related to plot_xy_NumGroup which requires a numeric grouping factor.
When summary statistics (mean/median) are required, use plot_3d_scatterbar, plot_3d_scatterbox or plot_4d_scatterbox.
Examples
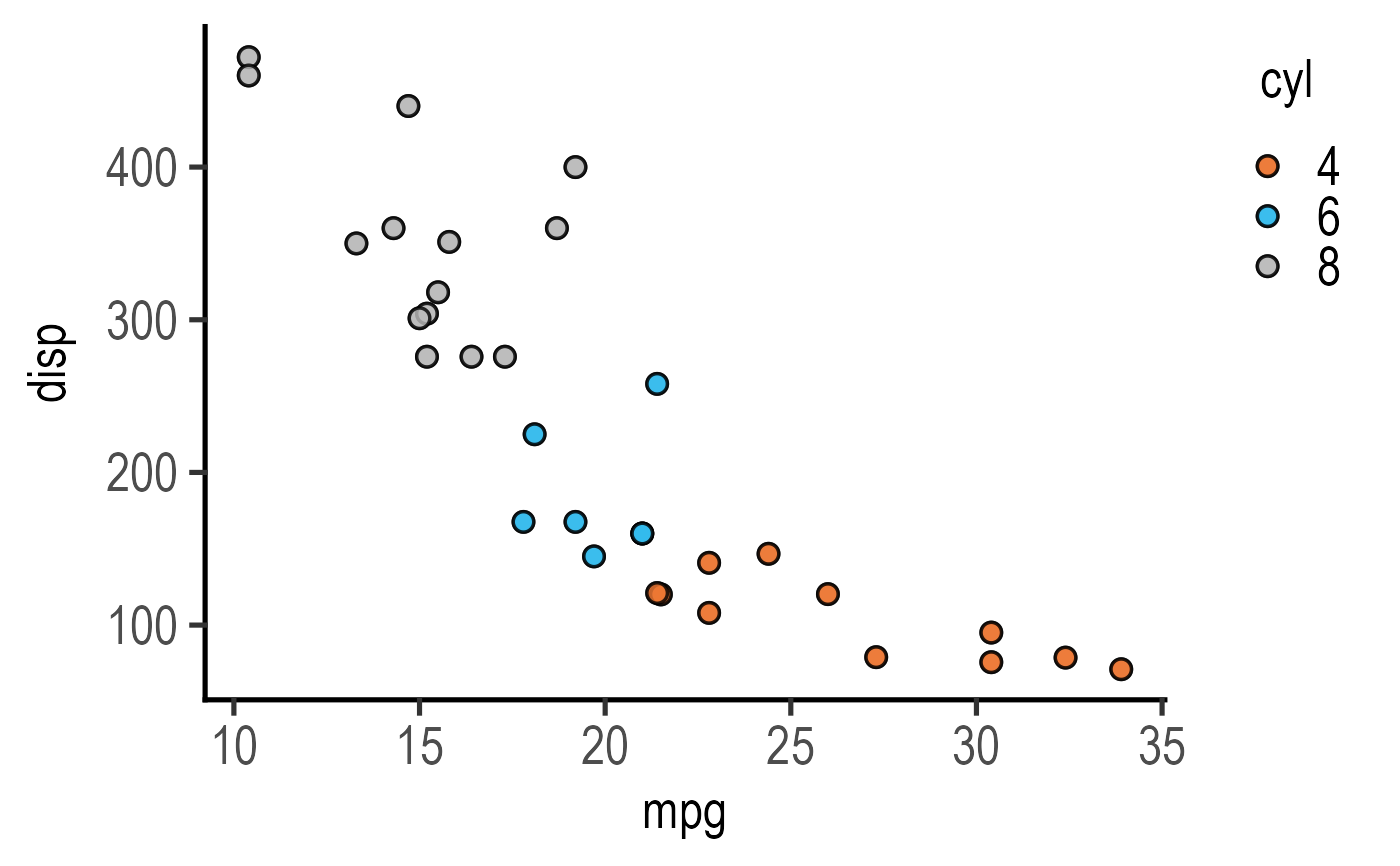
#The grouping factor cyl is automatically converted to categorical variable
plot_xy_CatGroup(data = mtcars,
xcol = mpg, ycol = disp, CatGroup = cyl,
ColPal = "vibrant", ColSeq = FALSE)
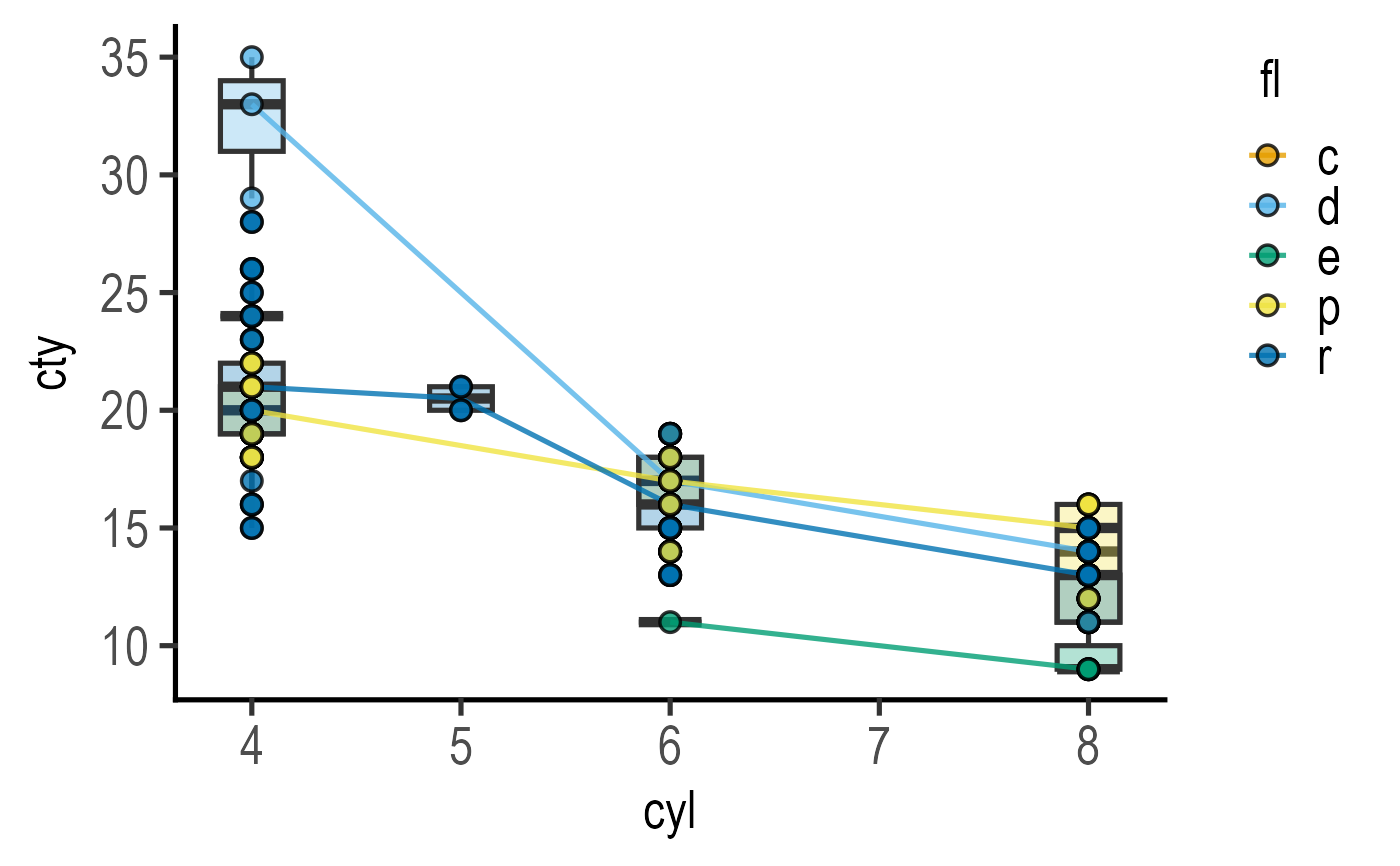
 #with boxplot
plot_xy_CatGroup(data = mpg,
xcol = cyl, ycol = cty,
CatGroup = fl, Boxplot = TRUE)
#with boxplot
plot_xy_CatGroup(data = mpg,
xcol = cyl, ycol = cty,
CatGroup = fl, Boxplot = TRUE)
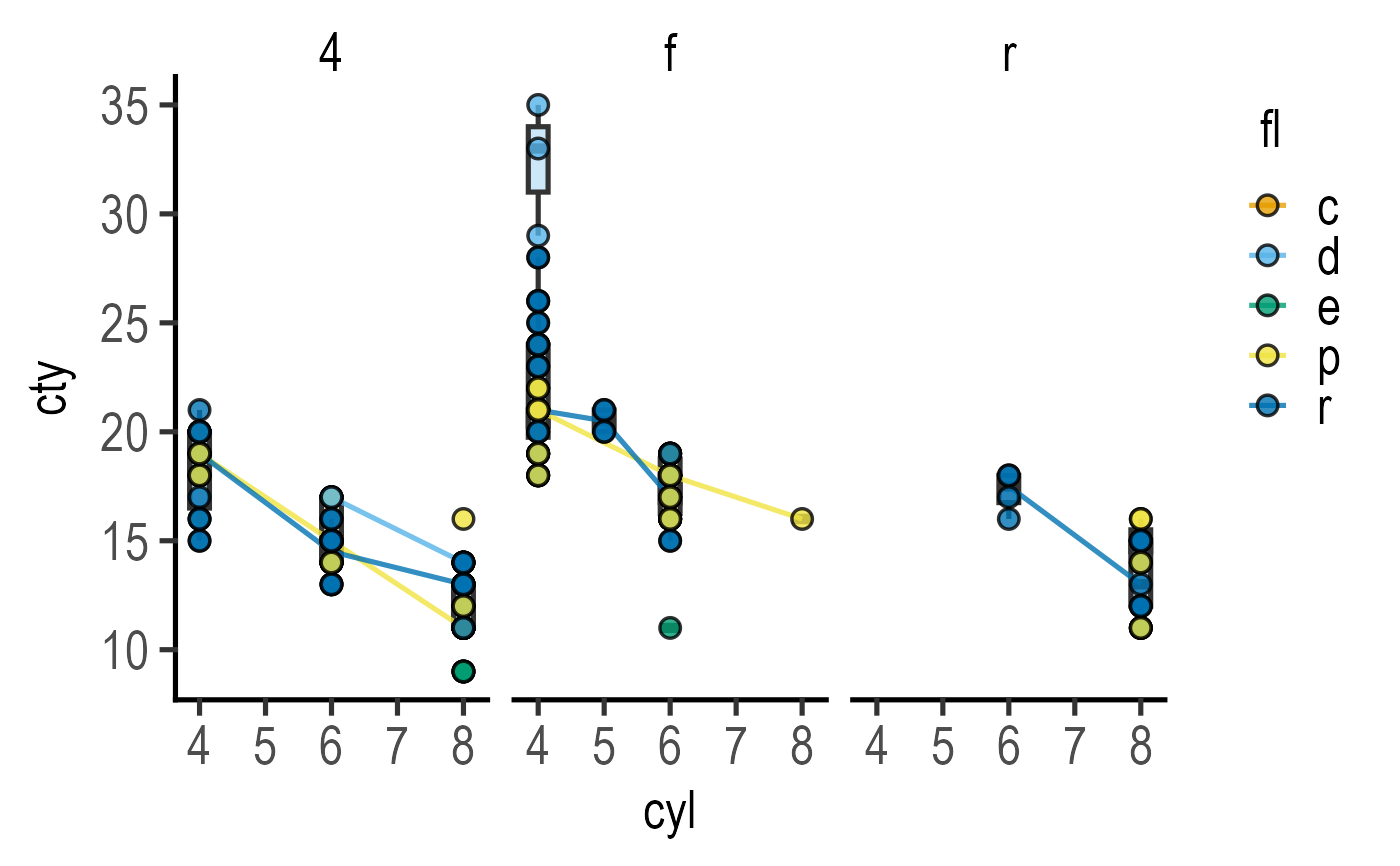
 #add another variable
#with boxplot
plot_xy_CatGroup(data = mpg,
xcol = cyl, ycol = cty,
CatGroup = fl, facet = drv,
Boxplot = TRUE)
#add another variable
#with boxplot
plot_xy_CatGroup(data = mpg,
xcol = cyl, ycol = cty,
CatGroup = fl, facet = drv,
Boxplot = TRUE)