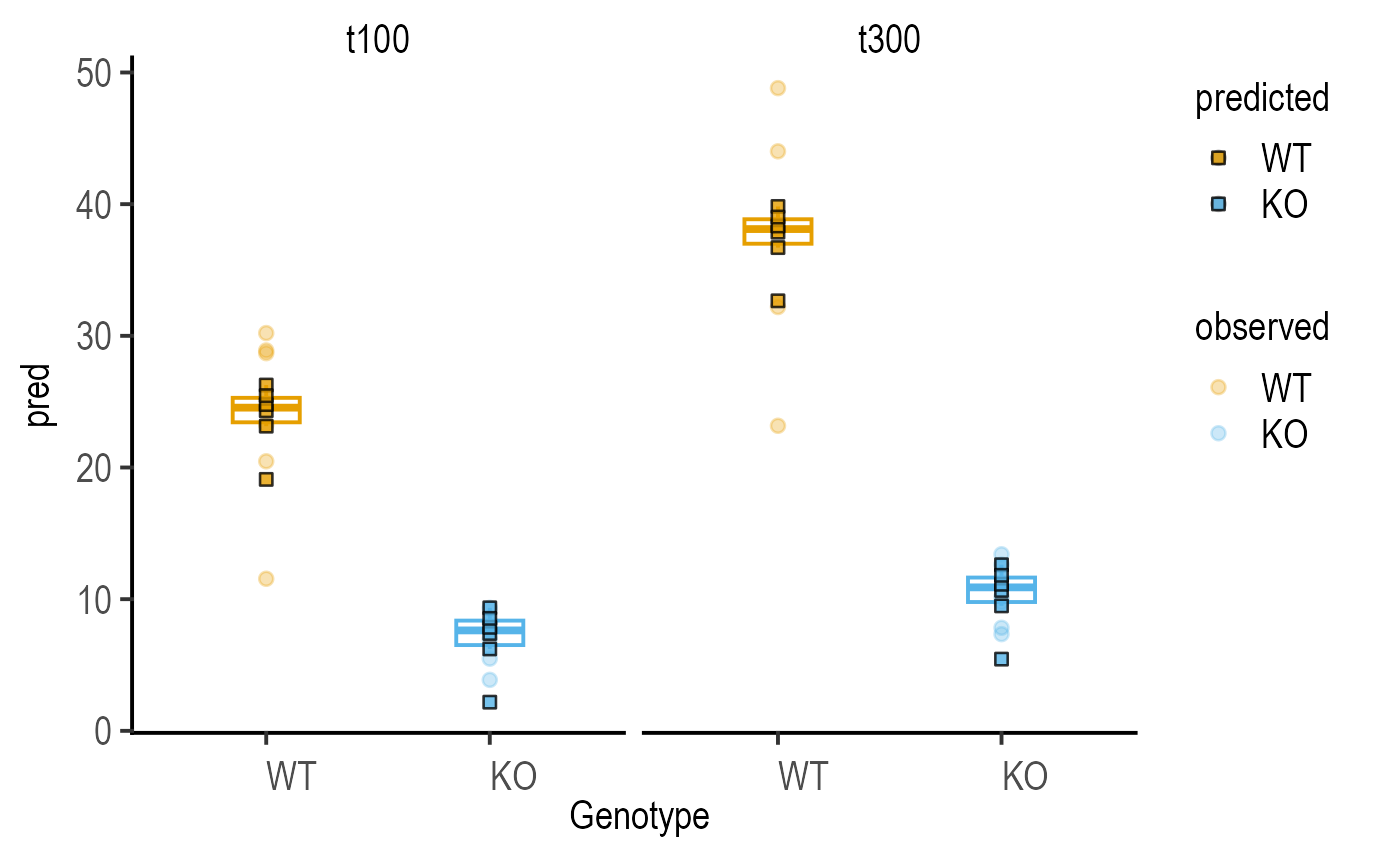
This function takes a linear model, and up to three variables and plots observe data (circles) and model predictions (squares). If the X-variable is categorical, a box and whiskers plot is overlaid. A variable (ByFactor) can be used for faceting.
plot_lm_predict(
  Model,
  xcol,
  ycol,
  ByFactor,
  obs_size = 2,
  obs_alpha = 0.3,
  pred_size = 2,
  pred_alpha = 0.8,
  linethick,
  base_size = 15,
  ...
)
Arguments
- Model
a linear model saved with
simple_model,mixed_modelorga_model.- xcol
variable along the X axis (should match one of the dependent variables in model exactly).
- ycol
independent variable along the Y axis (should match independent variable in model exactly).
- ByFactor
optional faceting variable (should match one of the variables in model exactly).
- obs_size
size of symbols for observed data (default = 2).
- obs_alpha
opacity of symbols for observed data (default = 0.3).
- pred_size
size of symbols for predicted data (default = 2).
- pred_alpha
opacity of symbols for predicted data (default = 0.8).
- linethick
thickness of border lines for boxes and symbols (default is base_size/20).
- base_size
base fontsize for
theme_grafify- ...
any other parameters to be passed to
theme_grafify
Value
This function returns a ggplot2 object of class "gg" and "ggplot".
Examples
#fit a model
deathm1 <- mixed_model(data_2w_Tdeath,
"PI", c("Genotype", "Time"),
"Experiment")
#> The new argument `AvgRF` is set to TRUE by default in >=5.0.0). Response variable is averaged over levels of Fixed and Random factors. Use help for details.
#plot model
plot_lm_predict(deathm1,
Genotype, PI, Time)
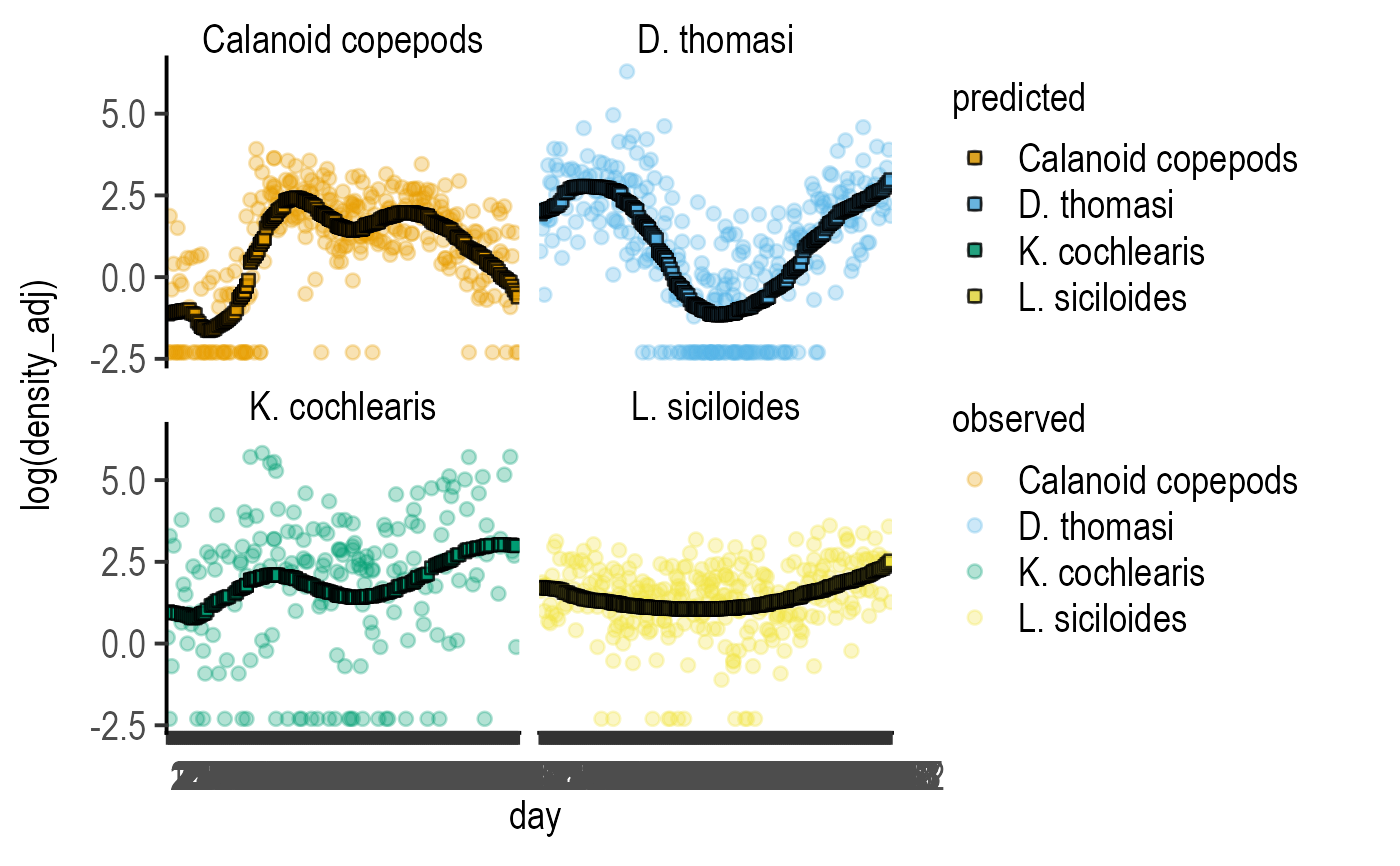
 #fit zooplankton data
z1 <- ga_model(data = data_zooplankton,
Y_value = "log(density_adj)",
Fixed_Factor = "taxon",
Smooth_Factor = "day")
#plot fitted data
plot_lm_predict(Model = z1,
xcol = day,
ycol = `log(density_adj)`,
ByFactor = taxon)
#fit zooplankton data
z1 <- ga_model(data = data_zooplankton,
Y_value = "log(density_adj)",
Fixed_Factor = "taxon",
Smooth_Factor = "day")
#plot fitted data
plot_lm_predict(Model = z1,
xcol = day,
ycol = `log(density_adj)`,
ByFactor = taxon)