This function takes a data table, a quantitative variable (ycol), and a categorical grouping variable (group), if available, and plots a QQ graph using stat_qq and stat_qq_line. Alternatives are plot_histogram, or plot_qqline.
plot_qqline(
  data,
  ycol,
  group,
  facet,
  symsize = 3,
  s_alpha = 0.8,
  TextXAngle = 0,
  facet_scales = "fixed",
  fontsize = 20,
  symthick,
  linethick,
  ColPal = c("okabe_ito", "all_grafify", "bright", "contrast", "dark", "fishy", "kelly",
    "light", "muted", "pale", "r4", "safe", "vibrant"),
  ColSeq = TRUE,
  ColRev = FALSE,
  ...
)
Arguments
- data
a data table e.g. data.frame or tibble.
- ycol
name of the column (without quotes) with the quantitative variable whose distribution is to be plotted.
- group
name of the column containing a categorical grouping variable.
- facet
add another variable (without quotes) from the data table to create faceted graphs using
facet_wrap.- symsize
size of symbols, default set to 3.
- s_alpha
fractional opacity of symbols, default set to 1 (i.e. maximum opacity & zero transparency).
- TextXAngle
orientation of text on X-axis; default 0 degrees. Change to 45 or 90 to remove overlapping text.
- facet_scales
whether or not to fix scales on X & Y axes for all facet facet graphs. Can be
fixed(default),free,free_yorfree_x(for Y and X axis one at a time, respectively).- fontsize
parameter of
base_sizeof fonts intheme_classic, default set to size 20.- symthick
thickness of symbol border, default set to
fontsize/22.- linethick
thickness of lines, default set to
fontsize/22.- ColPal
grafify colour palette to apply (in quotes), default "okabe_ito"; see
graf_palettesfor available palettes.- ColSeq
logical TRUE or FALSE. Default TRUE for sequential colours from chosen palette. Set to FALSE for distant colours, which will be applied using
scale_fill_grafify2.- ColRev
whether to reverse order of colour within the selected palette, default F (FALSE); can be set to T (TRUE).
- ...
any additional arguments to pass to
geom_qqorgeom_qq_line.
Value
This function returns a ggplot2 object of class "gg" and "ggplot".
Details
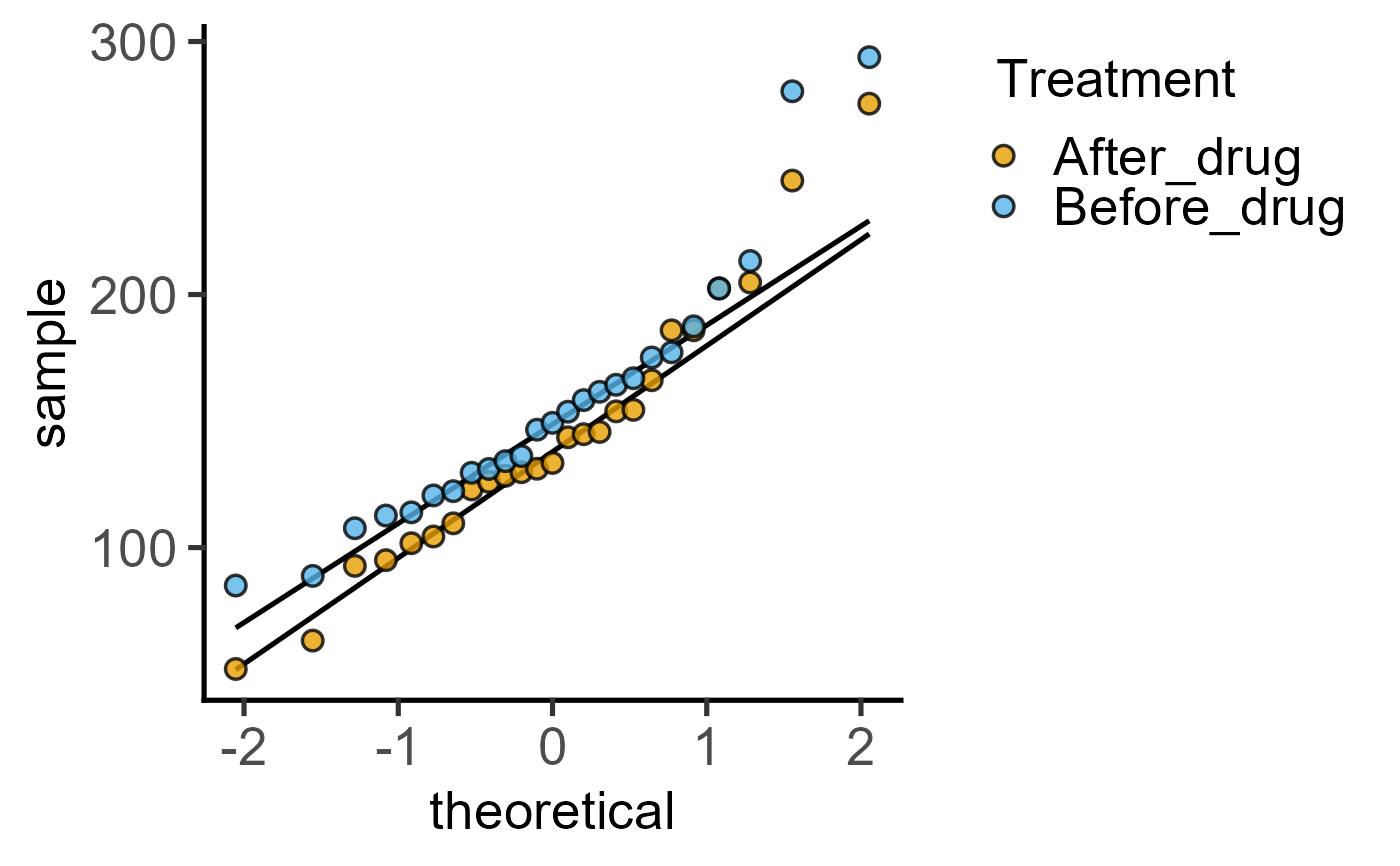
Note that the function requires the quantitative Y variable first, and a grouping variable as group if required. The graph plots sample quantiles on Y axis & theoretical quantiles on X axis. The X variable is mapped to the fill aesthetic instat_qq and colour aesthetic for the stat_qq_line.
Colours can be changed using ColPal, ColRev or ColSeq arguments. Colours available can be seen quickly with plot_grafify_palette. When only one level is present within group, symbols will receive "ok_orange" colour.
ColPal can be one of the following: "okabe_ito", "dark", "light", "bright", "pale", "vibrant, "muted" or "contrast".
ColRev (logical TRUE/FALSE) decides whether colours are chosen from first-to-last or last-to-first from within the chosen palette.
ColSeq decides whether colours are picked by respecting the order in the palette or the most distant ones using colorRampPalette.
Examples
plot_qqline(data = data_cholesterol,
ycol = Cholesterol, group = Treatment)